HPA - Custom Metrics (http_requests_per_second)
13th Sep 2023

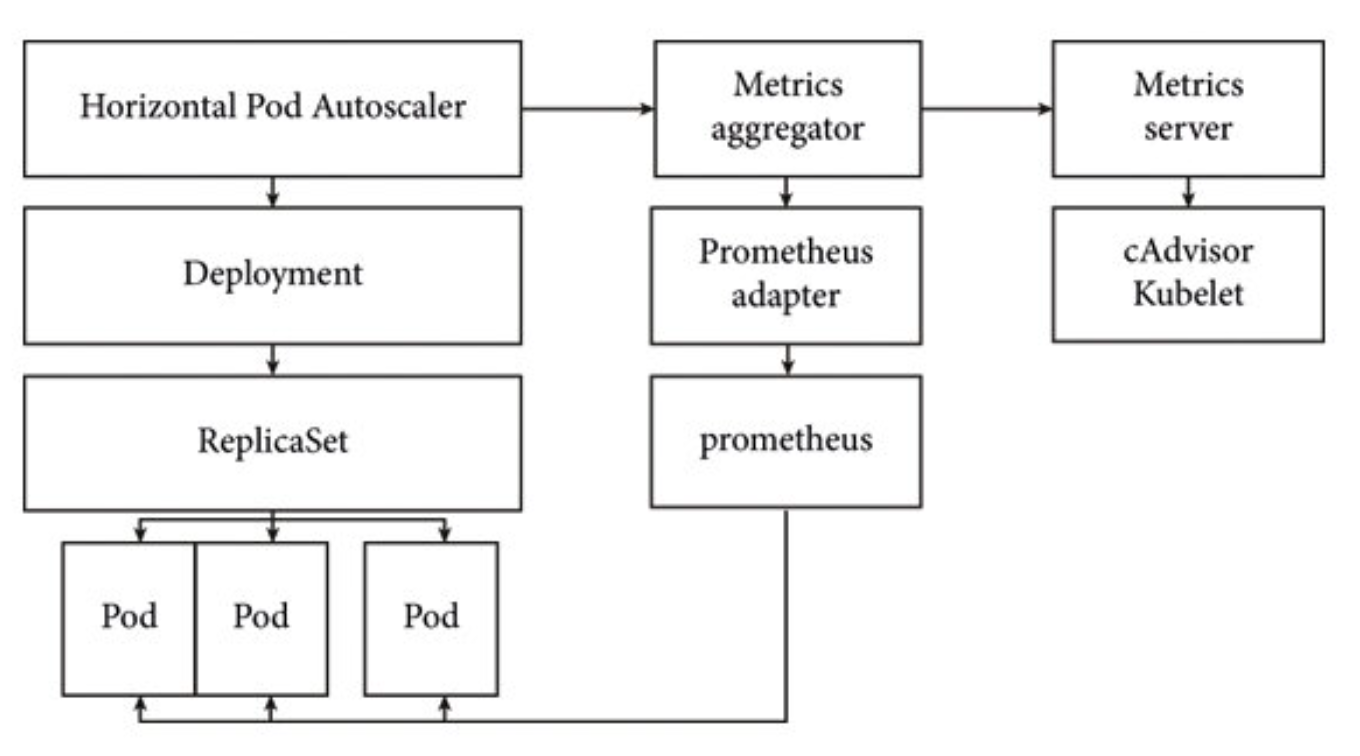
HPA [ Horizontal Pod Autoscaler]. It is a resource and a feature that automatically adjusts the number of replica pods in a deployment or replica set based on the observed CPU utilization or custom metrics. The primary goal of HPA is to ensure that the desired number of replicas are available to handle varying levels of workload, helping maintain application performance and responsiveness while optimizing resource utilization.
Assumption -
- k8s cluster is already setup with running applications.
-
Prometheus is already installed and running with following labels -
-- serviceMonitorSelector: team: devops
-- serviceMonitorNamespaceSelector: monitoring: prometheus
note - you can change the labels as per your choice.
-
Below explained the working the hpa with custom metrics -
Custom Metrics based on http request -
-
Firstly we have to add the /metrics endpoint in the Application itself and this endpoint will be used by the prometheus server itself to get the total number of request . Add the following code to your applications app.js file of the application you want to autoscale.
const { Counter, register } = require('prom-client'); // metrics endpoint const counter = new Counter({ name: "http_requests_total", help: "Total number of http requests", labelNames: ["method"], }); app.get("/metrics", async (req, res) => { res.set('Content-Type', register.contentType); res.end(await register.getSingleMetricAsString('http_requests_total')); }); Add the package dependencies in the package.json "prom-client": "^14.2.0", -
Hit the curl request or port forward the application like - http://localhost:
/metrics and check if you are able to see the metrics . 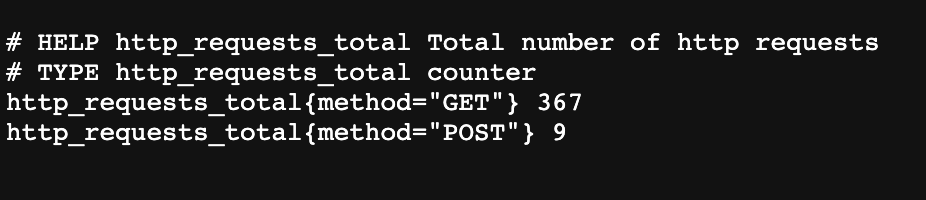
-
Add the label to the namespace where the Application is running , label - monitoring=prometheus which will be used by the Prometheus Operator to select the servicemonitor.
labels: monitoring: prometheus -
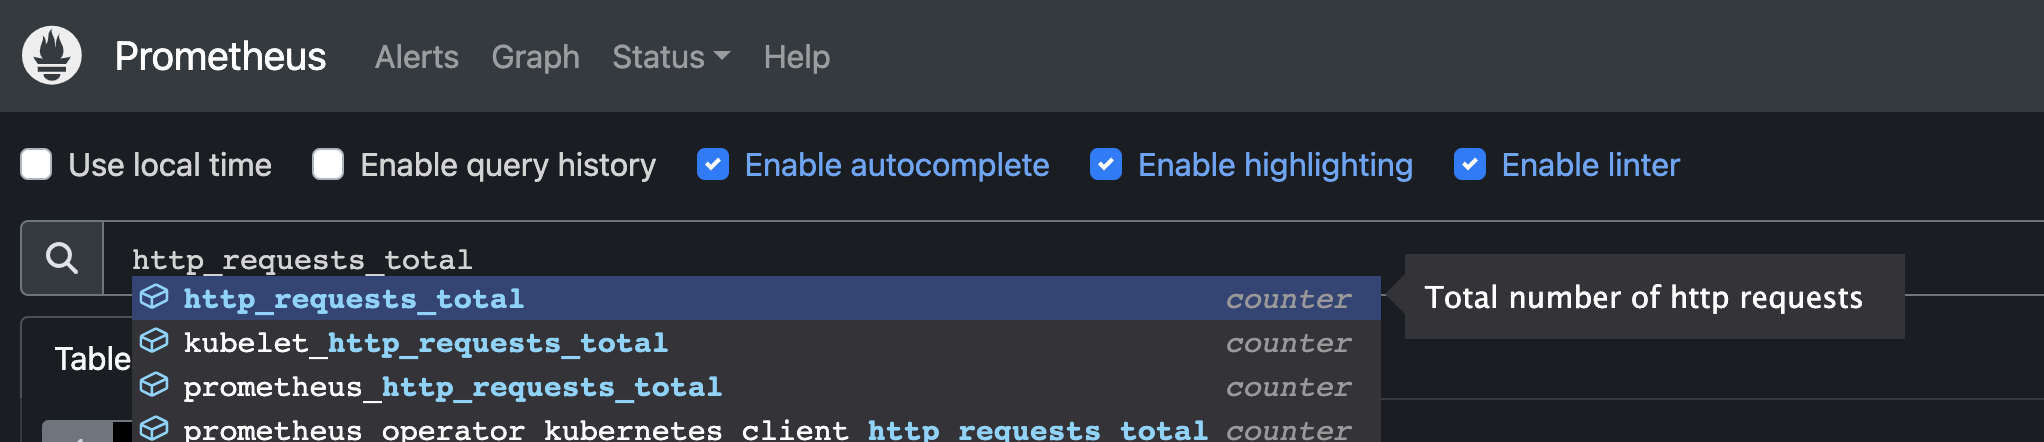
Open the Prometheus UI and you’ll be able to se the http_request_total parameter now which was not available earlier. It is neccesary to hit the application to get the parameter in prometheus UI.
- Right now we have all the metrics only in the prometheus and we need to connect the Prometheus Server with the Kubernetes API.
- The Horizontal pod autoscaler will query the custom metrics API and k8s will redirect it to the prometheus.
- We just need to convert the hpa controller query to the prometheus query and here the prometheus adapter will help us .
-
Create and Deploy the Prometheus adapter using the following file -
rbac.yaml file ---- apiVersion: v1 kind: ServiceAccount metadata: labels: app: prometheus-adapter name: custom-metrics-prometheus-adapter namespace: monitoring --- apiVersion: rbac.authorization.k8s.io/v1 kind: ClusterRoleBinding metadata: labels: app: prometheus-adapter name: prometheus-adapter-system-auth-delegator roleRef: apiGroup: rbac.authorization.k8s.io kind: ClusterRole name: system:auth-delegator subjects: - kind: ServiceAccount name: custom-metrics-prometheus-adapter namespace: monitoring --- apiVersion: rbac.authorization.k8s.io/v1 kind: ClusterRoleBinding metadata: labels: app: prometheus-adapter name: prometheus-adapter-resource-reader roleRef: apiGroup: rbac.authorization.k8s.io kind: ClusterRole name: prometheus-adapter-resource-reader subjects: - kind: ServiceAccount name: custom-metrics-prometheus-adapter namespace: monitoring --- apiVersion: rbac.authorization.k8s.io/v1 kind: ClusterRole metadata: labels: app: prometheus-adapter name: prometheus-adapter-resource-reader rules: - apiGroups: - "" resources: - namespaces - pods - services - configmaps verbs: - get - list - watch --- apiVersion: rbac.authorization.k8s.io/v1 kind: RoleBinding metadata: labels: app: prometheus-adapter name: prometheus-adapter-auth-reader namespace: kube-system roleRef: apiGroup: rbac.authorization.k8s.io kind: Role name: extension-apiserver-authentication-reader subjects: - kind: ServiceAccount name: custom-metrics-prometheus-adapter namespace: monitoringconfigmap.yaml ---- apiVersion: v1 kind: ConfigMap metadata: name: custom-metrics-prometheus-adapter namespace: monitoring labels: app: prometheus-adapter data: config.yaml: | rules: - seriesQuery: 'http_requests_total{namespace!="",pod!=""}' resources: overrides: namespace: resource: namespace pod: resource: pod name: matches: "^(.*)_total" as: "${1}_per_second" metricsQuery: 'sum(rate(<<.Series>>{<<.LabelMatchers>>}[2m])) by (<<.GroupBy>>)'deployment.yaml ---- apiVersion: apps/v1 kind: Deployment metadata: name: custom-metrics-prometheus-adapter namespace: monitoring spec: replicas: 1 selector: matchLabels: app: prometheus-adapter template: metadata: labels: app: prometheus-adapter name: prometheus-adapter annotations: checksum/config: 4b70a56e35e56c8038b94f63f0515e79f22bd49456902c2f3c3d2dd9b2474ece spec: serviceAccountName: custom-metrics-prometheus-adapter containers: - name: prometheus-adapter image: "directxman12/k8s-prometheus-adapter-amd64:v0.8.4" imagePullPolicy: IfNotPresent args: - /adapter - --secure-port=6443 - --cert-dir=/tmp/cert - --logtostderr=true - --prometheus-url=http://prometheus-kube-prometheus-prometheus.monitoring.svc:9090 - --metrics-relist-interval=1m - --v=4 - --config=/etc/adapter/config.yaml ports: - containerPort: 6443 name: https livenessProbe: httpGet: path: /healthz port: https scheme: HTTPS initialDelaySeconds: 30 timeoutSeconds: 5 readinessProbe: httpGet: path: /healthz port: https scheme: HTTPS initialDelaySeconds: 30 timeoutSeconds: 5 resources: limits: cpu: 100m memory: 128Mi requests: cpu: 100m memory: 128Mi securityContext: allowPrivilegeEscalation: false capabilities: drop: ["all"] readOnlyRootFilesystem: true runAsNonRoot: true runAsUser: 10001 volumeMounts: - - mountPath: /etc/adapter/ name: config readOnly: true mountPath: /tmp name: tmp volumes: - name: config configMap: name: custom-metrics-prometheus-adapter - name: tmp emptyDir: {}NOTE - In line 30 , make sure to enter the correct prometheus service name and url.
service.yaml ---- apiVersion: v1 kind: Service metadata: name: custom-metrics-prometheus-adapter namespace: monitoring labels: app: prometheus-adapter spec: ports: - port: 443 protocol: TCP targetPort: https selector: app: prometheus-adapter type: ClusterIP -
Create and Deploy the Prometheus adapter using the following file -
rbac.yaml file -
                    ---
apiVersion: rbac.authorization.k8s.io/v1
kind: ClusterRole
metadata:
  labels:
    app: prometheus-adapter
  name: prometheus-adapter-server-resources
rules:
- apiGroups:
  - custom.metrics.k8s.io
  resources: ["*"]
  verbs: ["*"]
---
apiVersion: rbac.authorization.k8s.io/v1
kind: ClusterRoleBinding
metadata:
  labels:
    app: prometheus-adapter
  name: prometheus-adapter-hpa-controller
roleRef:
  apiGroup: rbac.authorization.k8s.io
  kind: ClusterRole
  name: prometheus-adapter-server-resources
subjects:
- kind: ServiceAccount
  name: custom-metrics-prometheus-adapter
  namespace: monitoring
apiservice.yaml file ---- apiVersion: apiregistration.k8s.io/v1 kind: APIService metadata: name: v1beta1.custom.metrics.k8s.io labels: app: prometheus-adapter spec: service: name: custom-metrics-prometheus-adapter namespace: monitoring group: custom.metrics.k8s.io version: v1beta1 insecureSkipTLSVerify: true groupPriorityMinimum: 100 versionPriority: 100 -
Deploy the prometheus adapter and custom metrics in the k8s cluster using kubectl command.
                    kubectl apply -f prometheus-adaptor/adaptor
                    kubectl apply -f prometheus-adaptor/custom-metrics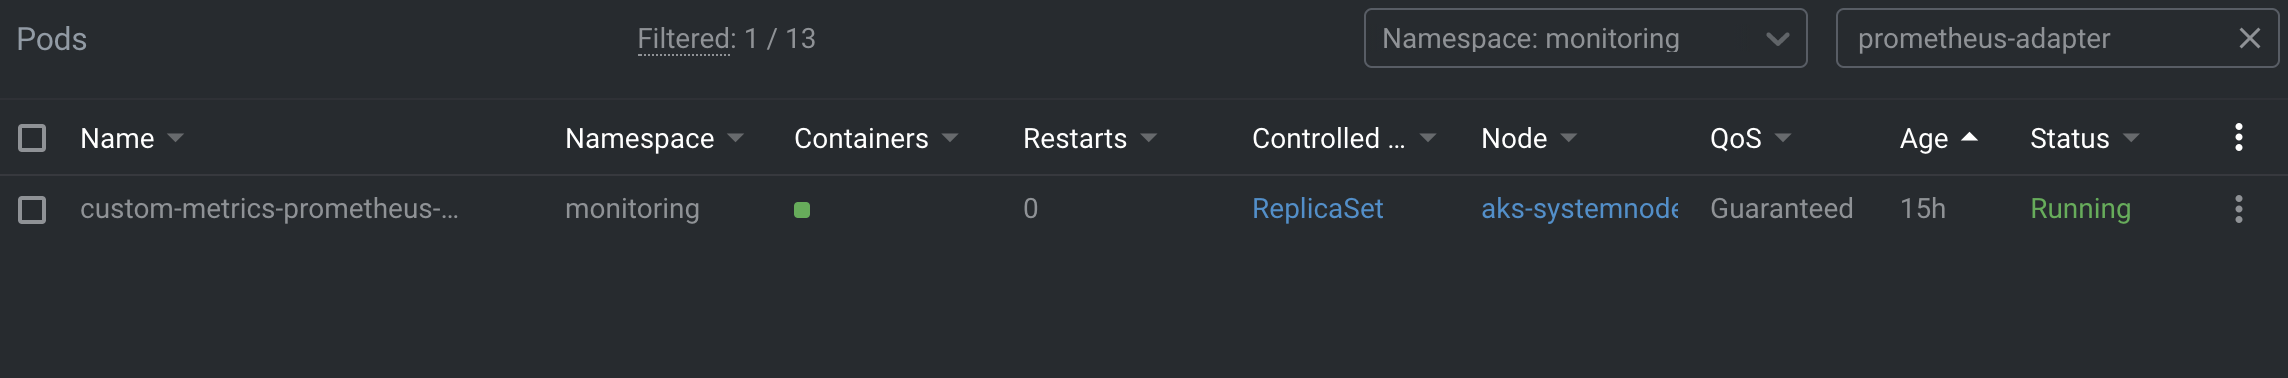
-
To verify run - kubectl get apiservice , you will see the custom metrics api server in ready state .

-
Verify that you can see the HTTP request per second metrics available and can be used by the Horizontal Pod Autoscalers with the help of following command -
kubectl get --raw /apis/custom.metrics.k8s.io/v1beta1 | jq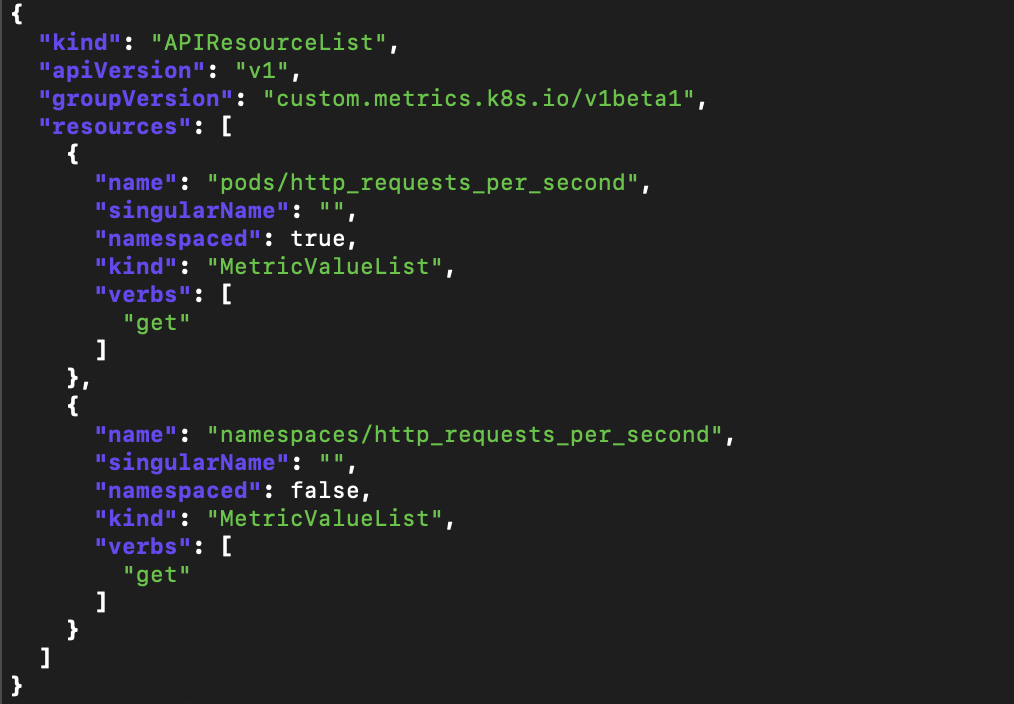
-
Now create and deploy an service monitor for your application -
--- apiVersion: monitoring.coreos.com/v1 kind: ServiceMonitor metadata: name: servicemonitor-name namespace: namespace-name labels: team: devops spec: endpoints: - port: http interval: 15s namespaceSelector: matchNames: -selector: matchLabels: app.kubernetes.io/name: deployment-labels Note - Make sure it contains the labels we included in the prometheus i.e team=devops and the selector will be the application label.
-
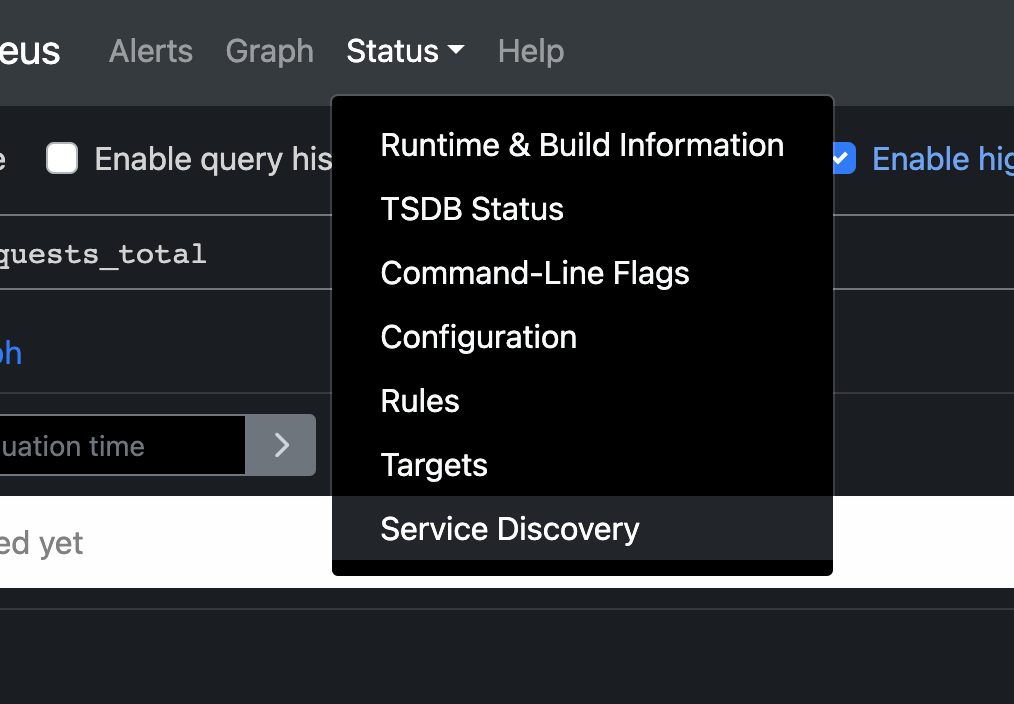
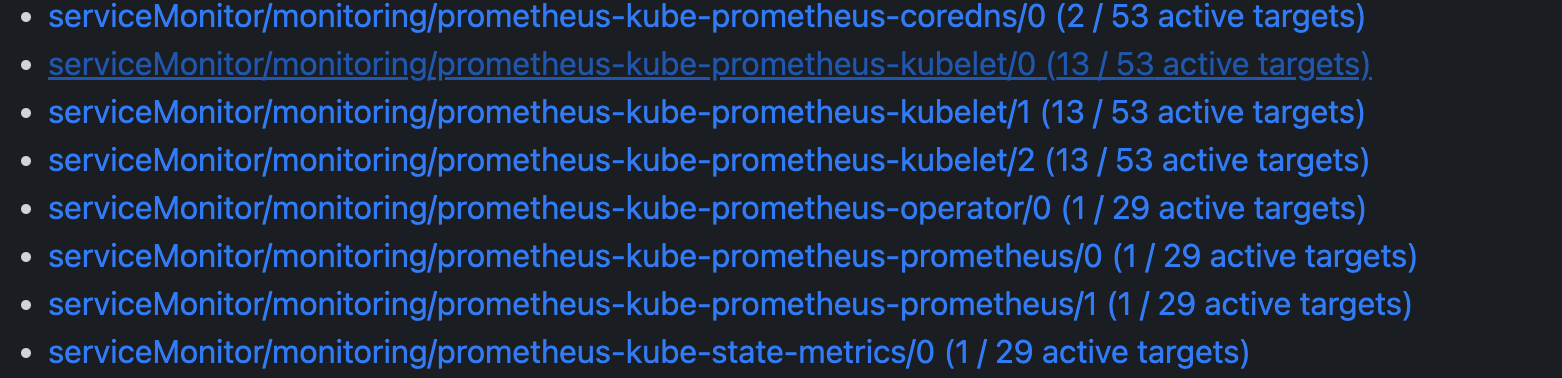
Go to the prometheus UI and select status , then service discovery , you must see your newly created service monitor . It make take some couple of minutes.
-
Now create and deploy the HorizontalPodAutoscaler with the following file -
--- kind: HorizontalPodAutoscaler apiVersion: autoscaling/v2beta2 metadata: name:namespace: spec: scaleTargetRef: apiVersion: apps/v1 kind: Deployment name: minReplicas: 1 maxReplicas: 3 metrics: # use a # given - type: "Pods" metric, which takes the average of the metric across all pods controlled by the autoscaling target Pods pods: metric: # use the metric that you used above: pods/http_requests name: http_requests_per_second target: # target 1000 milli-requests per second, # which is 1 request every one seconds type: AverageValue averageValue: 1000m -
Run the following command to check the status of the HPA , it must be active now -
kubectl get hpa -n - You must get the targets as 0/1. it means its working and will be receiving the http_request.
- You can test the working of the HPA now , it will autoscale the pods of the application when the averagevalue is breached and will also down the pods to the minimum pod value when the http request will decrease.